Assignment 0: Flashing and debugging
Prerequisites
Introduction
The goal of this assignment is that you understand how to flash and debug your code. You are provided with an example in the src/A0 directory of your repository which just needs to be build and uploaded to the pico.
As first step, you have to just build and flash the code. Have a look at Flashing and running (VSCode) or Flashing and running (CLion). You should also open the serial monitor as described in the guide and have a look at the output of the pico. It should look like this:
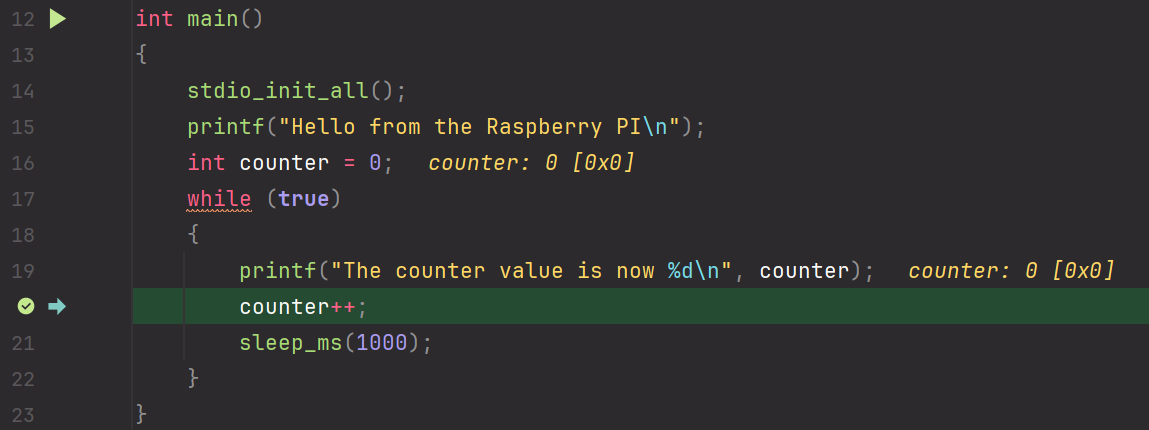
Next, click left of the line 20 to create a breakpoint: 
To start debugging the code, have a look at Debugging (VSCode) or Debugging (CLion).
You can also add a include for tusb.h using
and the add the following code to the main function below stdio_init_all();
This will let the board wait until the serial monitor is connected, allowing you to capture the whole output of the code. If no serial monitor is connected, the code will be in the while-loop forever
VS Code
If you are using VSCode, the code will immediately halt execution after starting. The immediate halt in the main function was disabled in the upstream repo, therefore the code will run until the first checkpoint is reached.
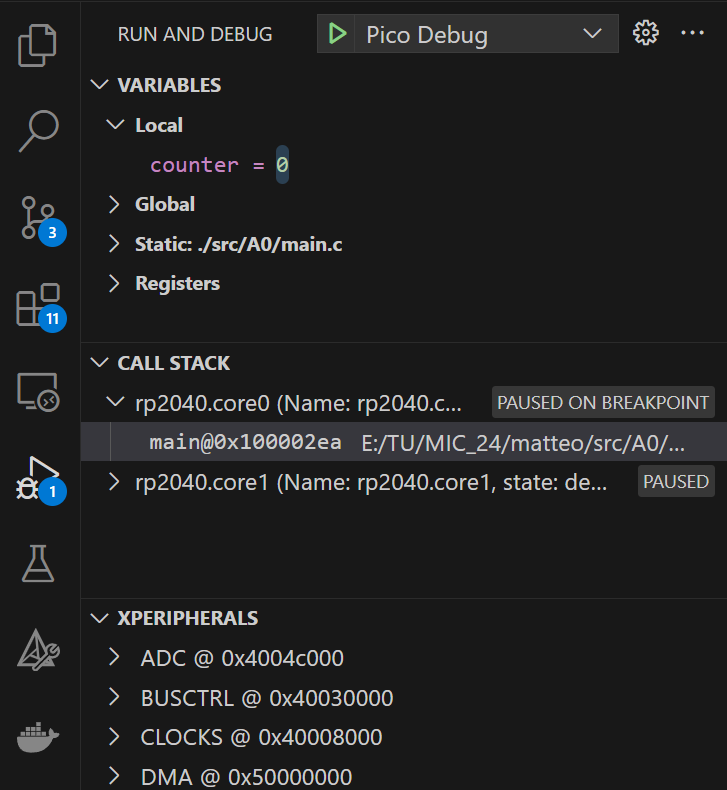
Visual Studio Code will show the current variable values, call stack and register contents (displayed in XPERIPHERALS tab) on the left side of the screen: 
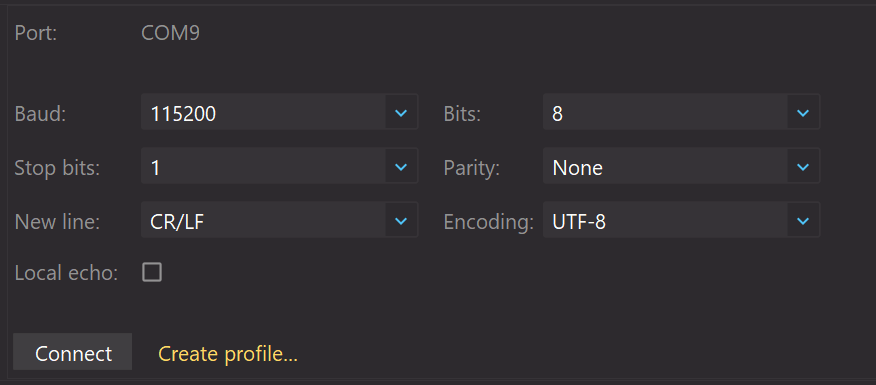
To view the serial output of the board, you can click on the Serial Monitor tab at the bottom of the screen. Select the COM port of the Pico, modify the settings to match those in the image below and press on Start monitoring. 
CLion
CLion shows the value of variables directly in the code, next to the last usage of the variable before the breakpoint: 
Load .svd file and select the file .openocd/svg/RP2040.svd.
To access the serial output of the board, you can click on the ![]()
Serial Connections tab at the bottom left of the screen. Select the COM port of the Pico, modify the settings to match those in the image below and press on Connect. 
Debugger controls


The debugger controls of both IDEs have very similar features:
Reset Device / Restart debugging: restarts the device using the debugger. The code will be executed again from the start of the
mainfunction.Continue / Pause: Pauses or continues the execution of the code. If a breakpoint is triggered, you will need to press
Continueto resume the program. The execution of the code can be stopped at any time using the pause button which allows you to see the current state of the Pico at any moment.Step over: With
Step overwe can, as soon as the execution is on hold, continue the execution for a single step. If the step consists of a function call, the debugger will not step into this function, but instead execute it and hold afterward.Step Into: This does the same as
Step over, but the debugger will step into functions and hold before the first line of the function is executed.Step Out: The debugger will continue execution until the end of the function is reached. As soon as we return from the function, the execution will be stopped.
Your task
Use the debugger to inspect variables, halt execution, step through the code and explore functions like sleep_ms. Create a file named submission.txt in the src/A0 directory and briefly explain what you did in a few sentences.
Afterward, commit, and push the file. Do not forget to tag the commit with SUBMISSION-A0. If you need assistance with using the integrated Git in the IDEs, check out the Using the integrated Git (VSCode) or Using the integrated Git (CLion) tutorials.
Deliverables
submission.txtinsrc/A0describing what you did... do not forget to tag the final commit with
SUBMISSION-A0and push the tag
Interview questions
How does debugging the Pico work and which two tools are used in this course?
What happens when the processor reaches a breakpoint? When will execution resume?
What is the maximum number of (hardware) breakpoints the Pico supports? Is this a limit of the Pico or the debugger?
Explain one of the following debugger controls in detail: Step over, Step into, Step out